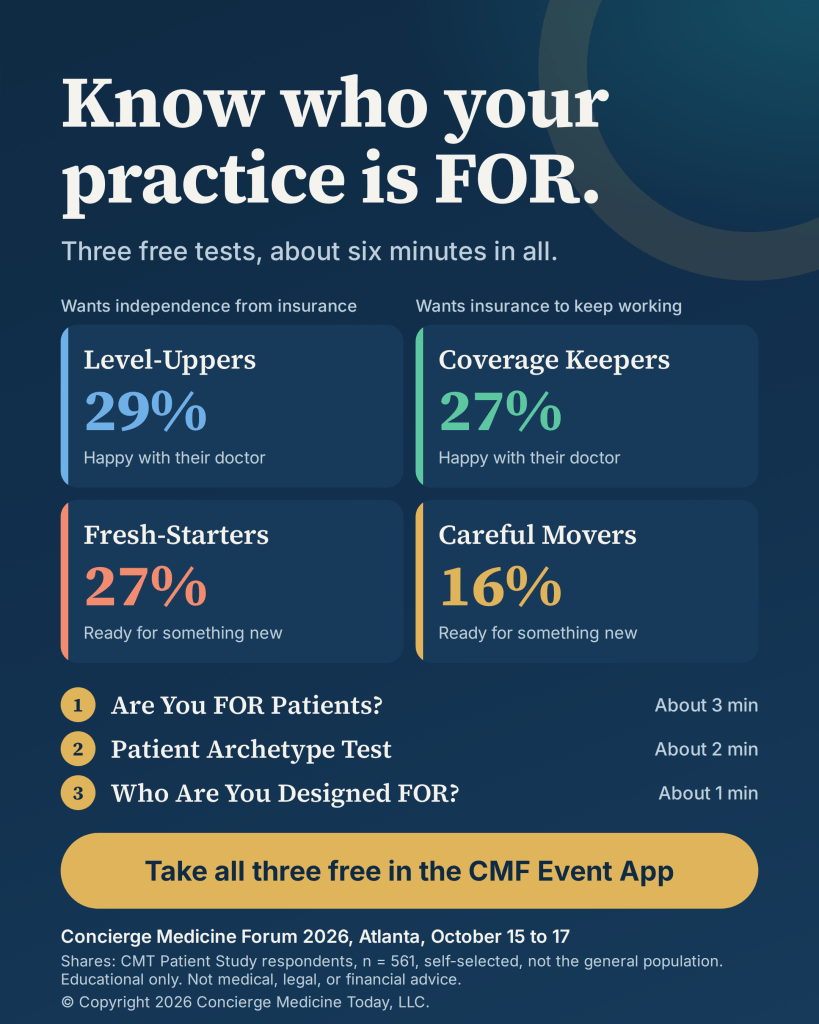


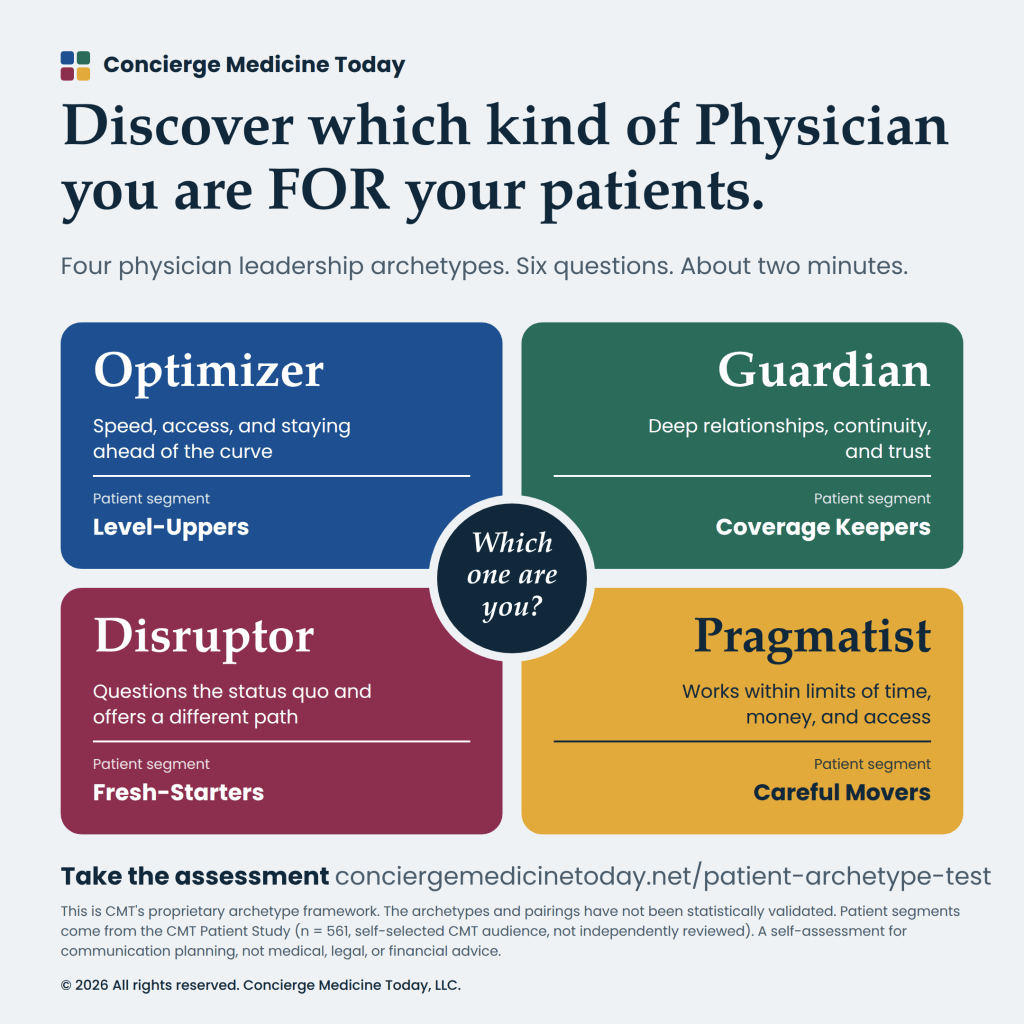

 Announcing CMT’s Visuals page: real survey data, real market comparisons, built with the same editorial standard we’ve always held ourselves to.
Article written Summer 2026 by Concierge Medicine Today
You already know something is shifting.
Patients are asking different questions today. Visits feel more rushed than they used to, even in your concierge practice.
Staff are fielding conversations, interrupting you in the back office and there are questions at the front desk that didn’t used to come up. You can feel the drift, but explaining it clearly, to your team, your accountant, or even yourself, is a different challenge entirely.
We’ve heard this from physicians for years. So we built something to help.
-
Announcing CMT’s (New) “Visuals” page, now live at conciergemedicinetoday.net/visuals.
Plus, CMTs (New) “Research Briefs” page, now live at conciergemedicinetoday.net/cmt-research-briefs
It’s not another article simply telling you what’s happening in concierge and membership medicine practices. It’s the data itself, visualized: original patient survey results, market comparisons, and industry trend charts, all the pesky questions you’ve thought in your head, all built to be understood in minutes, not studied for hours.
What You’ll Actually Find at CMTs “Visuals” Page
- Why patients really leave. Survey responses on what pushes patients out of a traditional practice and keeps them “coming back” to a concierge practice.
- Who is choosing concierge medicine, and why. Age, income, and generational data on the patients filling these practices today.
- The business case, side by side. Visit time, patient ratings, and satisfaction scores, traditional versus concierge, in one glance.
- Where AI is already changing patient behavior. Early data on a shift most of the industry hasn’t caught up to yet. (Access the full report PDF here)
- The cultural edge nobody else is talking about. Why gratitude, not urgency, is becoming the real differentiator for practices built to last.
Here’s your next step
- Visit the “Visuals” page. Five minutes is enough to walk away with something useful.
- Share it with your team. Front desk, care coordinators, billing, everyone benefits from a shared, visual language for what’s changing and why.
- Use it. Reference it in patient conversations, staff meetings, or your own strategic planning, knowing exactly where each number came from.
 Keep guessing, and you’ll keep explaining your practice’s future with instinct instead of evidence, while other publications recycle the same year-old claims. Or you and your team can walk in already ahead of that conversation, with the data already in hand.
As we say around here often “It is no longer about being the best doctor in the world anymore, it’s about being the best doctor for the world, for your patients, and for your community. This new educational resource exists to help you prove it.
- Explore it here now: conciergemedicinetoday.net/visuals
A note on sourcing: CMT’s own survey data is clearly labeled with respondent counts and years. Some visuals also cite outside sources (Health Affairs, MedPAC, AMA, Becker’s, JAMA, Stanford); we’d encourage confirming those directly before citing them in your own materials. This page, these graphics and data is informational and does not constitute medical, legal, or financial advice.
Discover more from Concierge Medicine Today
Subscribe to get the latest posts sent to your email.
Categories: National Headlines